Reporting: Net Promoter Score (NPS) & Rating Scale
The reports for the Net Promoter Score (NPS) and the Rating Scale show you the distribution of responses, the score, the median and the trend over time.
Net Promoter Score
The NPS tile shows the Net Promoter Score:
NPS = share of Promoters (9–10) in % − share of Detractors (0–6) in %
Example: Of 200 responses, 100 come from Promoters (50 %), 60 from Passives (30 %) and 40 from Detractors (20 %). The NPS is 50 − 20 = 30.
The NPS is rounded to a whole number and ranges from −100 to +100. Passives (7–8) are included in the calculation but don't change the score directly.
Rating Scale
The ⌀ Rating tile shows the average: the sum of all ratings divided by the number of responses.
Median
The median (Median Rating) is calculated by listing all values in ascending order and determining the middle of this distribution.
All values only include respondents who answered the question.
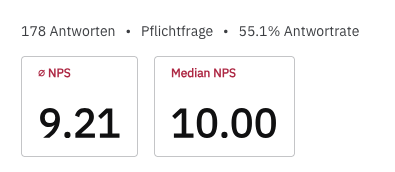
Evaluation of an NPS with average score and median NPS
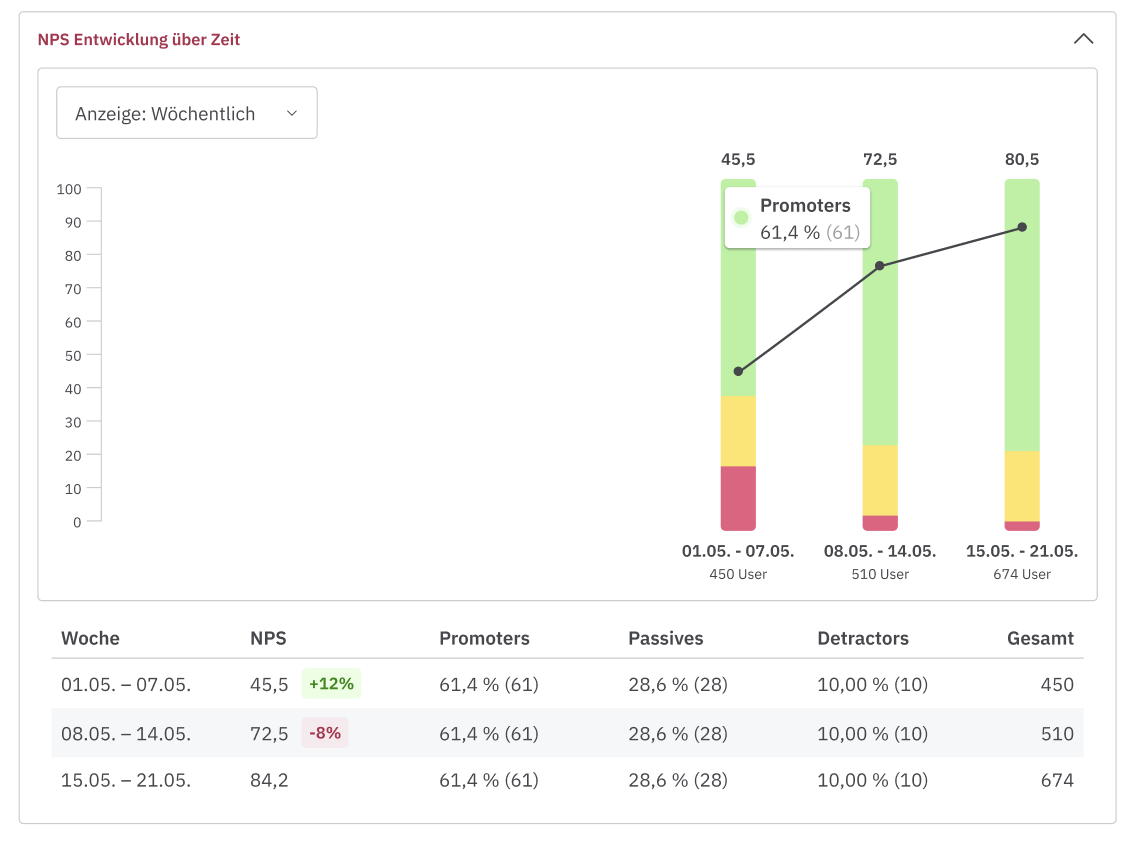
Trend over time
You can track the trend of NPS and rating over time, weekly or monthly. For NPS, you also see the difference from the previous period in points for each period. For example, if the NPS rises from 20 to 30, the difference is +10 points.
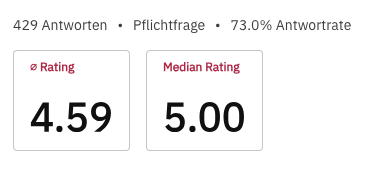
Evaluation of a Rating Scale with average score and median rating